BSIのダウンロードと解説|MT4インジケーター


BSIというMT4インジケーターがほしいです。
BSIインジケーターについて詳しく知りたいです。
 ホシノ
ホシノFXの不労所得だけで年収2000万を達成しました。
このお悩みに誠意をもって回答します。

このページでわかること・できること
〇BSIインジケーターのダウンロード
〇BSIについての詳しい解説
BSIインジケーターのダウンロード
ここからファイルのダウンロードが可能。
ダウンロードするファイルは.ex4ファイルであり、MT4データフォルダにあるインジケーターフォルダへファイルを移動すればインジケーターは使用できるようになる。
インストール方法
ダウンロードしたBSIインジケーターはMT4のデータフォルダからindicatorsフォルダへアクセスしファイルを移動する。
indicatorsフォルダにファイルを移動し、MT4を再起動すればインストールは完了する。
インストール手順の詳細は以下の記事を参照。

BSIとは?詳しく解説

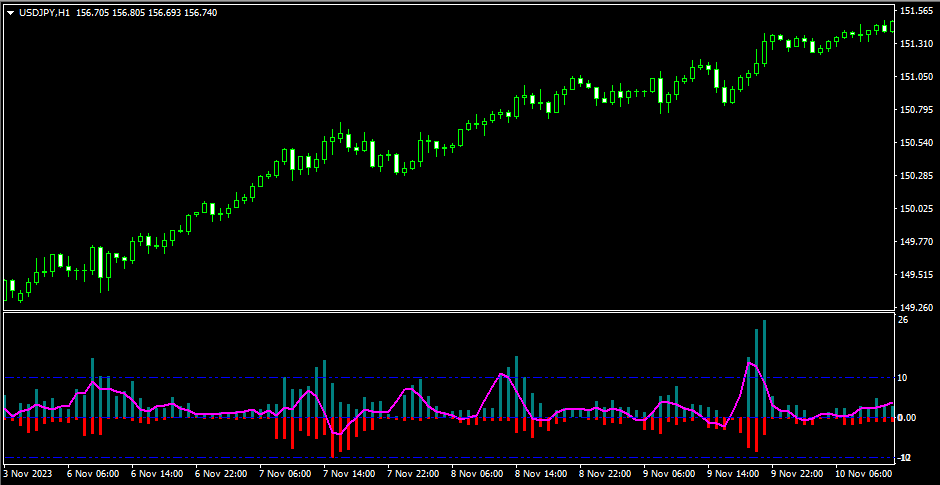
Bounce Strength Index (BSI)は、相場の反転力を測定するためのテクニカル指標だ。このインジケーターは相場がサポートやレジスタンスからどの程度反発しているかを視覚的に示す。以下に、BSIインジケーターの使い方や計算方法について詳しく説明する。
使い方
- トレンドの確認: BSIインジケーターは、相場がサポートラインから反発する強さ(Floor Bounce Strength)と、レジスタンスラインから反発する強さ(Ceiling Bounce Strength)を示す。
- 売買シグナルの確認:
- フロアバウンスストレングスが高い(例えば、ポジティブな値が大きい)場合は、買いシグナルと考える。
- シーリングバウンスストレングスが高い(例えば、ネガティブな値が大きい)場合は、売りシグナルと考える。
- 過去の動きの分析: 過去の値動きを振り返り、BSIがどのように反応したかを分析することで未来の動きを予測する。
BSIインジケーターの計算方法
1. パラメータの設定
以下のパラメータを設定:
- [math] ({InpRangePeriod})[/math] = 範囲期間
- [math]({InpSlowing})[/math] = スローイング
- [math]({InpAvgPeriod})[/math] = 平均期間
- [math]({InpUsingVolumeWeight})[/math] = ボリュームの使用方法
2. データの初期化
- 必要なバッファを初期化: [math]\text{ExtHighest}[], \, \text{ExtLowest}[], \, \text{ExtVolume}[][/math]
3. 最高値・最安値の計算
範囲期間内の最高値[math](d_{\max})[/math] と最安値 [math](d_{\min})[/math] を計算:
[math]d_{\max} = \max_{k=0}^{\text{InpRangePeriod} – 1} (\text{high}[ \text{bar} – k ])[/math]
[math]d_{\min} = \min_{k=0}^{\text{InpRangePeriod} – 1} (\text{low}[ \text{bar} – k ])[/math]
4. ボリュームの計算
ボリュームの重み付け方法に応じて、ボリューム [math](v_{\max})[/math] を計算:
[math]\text{volmax} = \begin{cases} 1.0 & \text{if } \text{InpUsingVolumeWeight} = \text{ENUM_WITHOUT_VOLUME} \\ \max_{k=0}^{\text{InpRangePeriod} – 1} (\text{volume}[ \text{bar} – k ]) & \text{if } \text{InpUsingVolumeWeight} = \text{ENUM_VOLUME} \\ \max_{k=0}^{\text{InpRangePeriod} – 1} (\text{tick_volume}[ \text{bar} – k ]) & \text{if } \text{InpUsingVolumeWeight} = \text{ENUM_TICKVOLUME} \end{cases}[/math]
5. ポジティブ・ネガティブバウンスストレングスの計算
各バーについて、スローイング期間の値を使ってポジティブバウンスストレングス [math]( \text{ExtPosBuffer} ) とネガティブバウンスストレングス ( \text{ExtNegBuffer} )[/math] を計算:
[math]\text{sumpos} = \sum_{k=0}^{\text{InpSlowing} – 1} \left( \frac{ (\text{close}[ \text{bar} – k ] – \text{low}[ \text{bar} – k ]) \times \text{ratio} \times \text{vol} }{ \text{sumhigh} } \right) \times 100 [/math]
[math] \text{sumneg} = \sum_{k=0}^{\text{InpSlowing} – 1} \left( \frac{ (\text{high}[ \text{bar} – k ] – \text{close}[ \text{bar} – k ]) \times \text{ratio} \times \text{vol} }{ \text{sumhigh} } \right) \times (-100)[/math]
6. 平均バウンスストレングスの計算
最後に、指定された平均期間を使用して、ポジティブ・ネガティブバウンスストレングスの平均を計算し、BSIバッファに格納する:
また、レシオ [math]( \text{ratio} )[/math] は以下のように計算:
[math][
\text{BSIBuffer}[ \text{bar} ] = \frac{ \sum_{k=0}^{\text{InpAvgPeriod} – 1} ( \text{ExtPosBuffer}[ \text{bar} – k ] + \text{ExtNegBuffer}[ \text{bar} – k ] ) }{ \text{InpAvgPeriod} }
][/math]
これにより、BSIインジケーターは相場のフロアバウンスストレングスとシーリングバウンスストレングスを計算し、これらの値を基にバウンスストレングスインデックス(BSI)を生成する。これにより、トレーダーは相場の反転力を視覚的に把握し、売買シグナルとして活用が可能となる。
BSIのプログラム
//+------------------------------------------------------------------+
//|                                                          BSI.mq4 |
//|                                     Copyright 2024, FX-Bonus.net |
//|                                            https://fx-bonus.net/ |
//+------------------------------------------------------------------+
#property copyright "Copyright 2024, FX-Bonus.net"
#property link      "https://fx-bonus.net/"
#property version   "1.00"
#property strict
#property indicator_separate_window
#property indicator_buffers 3
#property indicator_plots   3

//---- インジケータのパラメータ設定
#property indicator_type1 DRAW_HISTOGRAM
#property indicator_color1 clrTeal
#property indicator_style1 STYLE_SOLID
#property indicator_width1 2
#property indicator_label1 "Floor Bounce Strength"

#property indicator_type2 DRAW_HISTOGRAM
#property indicator_color2 clrRed
#property indicator_style2 STYLE_SOLID
#property indicator_width2 2
#property indicator_label2 "Ceiling Bounce Strength"

#property indicator_type3 DRAW_LINE
#property indicator_color3 clrMagenta
#property indicator_style3 STYLE_SOLID
#property indicator_width3 2
#property indicator_label3 "Bounce Strength Index"

#property indicator_level1  10.0
#property indicator_level2  0.0
#property indicator_level3 -10.0
#property indicator_levelcolor clrBlue
#property indicator_levelstyle STYLE_DASHDOTDOT

//+-----------------------------------+
//| 列挙型の宣言                        |
//+-----------------------------------+
enum Volume_Mode
{
   ENUM_WITHOUT_VOLUME = 1, // ボリュームを使用しない
   ENUM_VOLUME,             // ボリュームを使用する
   ENUM_TICKVOLUME          // ティックボリュームを使用する
};

//+-----------------------------------+
//| インジケータの入力パラメータ       |
//+-----------------------------------+
input uint InpRangePeriod = 20; // 範囲期間
input uint InpSlowing = 3;      // スローイング
input uint InpAvgPeriod = 3;    // 平均期間
input Volume_Mode InpUsingVolumeWeight = ENUM_TICKVOLUME; // ボリューム使用法

//+-----------------------------------+
//| グローバル変数の宣言              |
//+-----------------------------------+
int Count[];
double ExtHighest[], ExtLowest[], ExtVolume[];
int min_rates_total, size, min_rates_1;
double ExtPosBuffer[], ExtNegBuffer[], BSIBuffer[];

//+-----------------------------------+
//| 配列の最新要素の位置を再計算       |
//+-----------------------------------+
void Recount_ArrayZeroPos(int &CoArr[], int Size)
{
   int numb, Max1, Max2;
   static int count = 1;
   Max2 = Size;
   Max1 = Max2 - 1;
   count--;
   if(count < 0) count = Max1;
   for(int iii = 0; iii < Max2; iii++)
   {
      numb = iii + count;
      if(numb > Max1) numb -= Max2;
      CoArr[iii] = numb;
   }
}

//+-----------------------------------+
//| BSIインジケータの初期化関数       |
//+-----------------------------------+
void OnInit()
{
   min_rates_total = int(InpRangePeriod + InpSlowing + InpAvgPeriod);
   size = int(MathMax(InpRangePeriod, InpSlowing));
   min_rates_1 = size;
   ArrayResize(Count, size);
   ArrayResize(ExtHighest, size);
   ArrayResize(ExtLowest, size);
   ArrayResize(ExtVolume, size);

   SetIndexBuffer(0, ExtPosBuffer, INDICATOR_DATA);
   PlotIndexSetInteger(0, PLOT_DRAW_BEGIN, min_rates_total);
   PlotIndexSetDouble(0, PLOT_EMPTY_VALUE, EMPTY_VALUE);

   SetIndexBuffer(1, ExtNegBuffer, INDICATOR_DATA);
   PlotIndexSetInteger(1, PLOT_DRAW_BEGIN, min_rates_total);
   PlotIndexSetDouble(1, PLOT_EMPTY_VALUE, EMPTY_VALUE);

   SetIndexBuffer(2, BSIBuffer, INDICATOR_DATA);
   PlotIndexSetInteger(2, PLOT_DRAW_BEGIN, min_rates_total);
   PlotIndexSetDouble(2, PLOT_EMPTY_VALUE, EMPTY_VALUE);

   string shortname;
   StringConcatenate(shortname, "BSI( ", InpRangePeriod, ", ", InpSlowing, ", ", InpAvgPeriod, ", ", EnumToString(InpUsingVolumeWeight), " )");
   IndicatorSetString(INDICATOR_SHORTNAME, shortname);
   IndicatorSetInteger(INDICATOR_DIGITS, 0);
}

//+-----------------------------------+
//| BSI計算関数                       |
//+-----------------------------------+
int OnCalculate(const int rates_total, const int prev_calculated, const datetime &time[], const double &open[], const double &high[], const double &low[], const double &close[], const long &tick_volume[], const long &volume[], const int &spread[])
{
   if(rates_total < min_rates_total) return(0);
   int first1, first2, bar;

   if(prev_calculated > rates_total || prev_calculated <= 0)
   {
      first1 = min_rates_1;
      first2 = min_rates_total;
      ArrayInitialize(Count, NULL);
      ArrayInitialize(ExtHighest, NULL);
      ArrayInitialize(ExtLowest, NULL);
      ArrayInitialize(ExtVolume, NULL);
   }
   else
   {
      first1 = prev_calculated - 1;
      first2 = first1;
   }

   for(bar = first1; bar < rates_total && !IsStopped(); bar++)
   {
      double dmin = 1000000.0;
      double dmax = -1000000.0;
      double volmax = NULL;
      for(int kkk = 0; kkk < int(InpRangePeriod); kkk++)
      {
         dmin = MathMin(dmin, low[bar - kkk]);
         dmax = MathMax(dmax, high[bar - kkk]);
      }
      ExtLowest[Count[0]] = dmin;
      ExtHighest[Count[0]] = dmax;

      switch(InpUsingVolumeWeight)
      {
         case ENUM_WITHOUT_VOLUME:
            ExtVolume[Count[0]] = 1.0;
            break;
         case ENUM_VOLUME:
            for(int kkk = 0; kkk < int(InpRangePeriod); kkk++) volmax = MathMax(volmax, volume[bar - kkk]);
            ExtVolume[Count[0]] = volmax;
            break;
         case ENUM_TICKVOLUME:
            for(int kkk = 0; kkk < int(InpRangePeriod); kkk++) volmax = MathMax(volmax, tick_volume[bar - kkk]);
            ExtVolume[Count[0]] = volmax;
            break;
      }

      double sumpos = NULL;
      double sumneg = NULL;
      double sumhigh = NULL;
      for(int kkk = 0; kkk < int(InpSlowing); kkk++)
      {
         int barkkk = bar - kkk;
         double vol = 1.0;
         switch(InpUsingVolumeWeight)
         {
            case ENUM_WITHOUT_VOLUME:
               break;
            case ENUM_VOLUME:
               if(ExtVolume[Count[kkk]]) vol = volume[barkkk] / ExtVolume[Count[kkk]];
               break;
            case ENUM_TICKVOLUME:
               if(ExtVolume[Count[kkk]]) vol = tick_volume[barkkk] / ExtVolume[Count[kkk]];
               break;
         }

         double ratio = 0;
         double range = ExtHighest[Count[kkk]] - ExtLowest[Count[kkk]];
         range = MathMax(range, _Point);
         double sp = (high[barkkk] - low[barkkk]);

         if(!(close[barkkk - 1] - sp * 0.2 > close[barkkk]))
         {
            if(low[barkkk] == ExtLowest[Count[kkk]]) ratio = 1;
            else ratio = (ExtHighest[Count[kkk]] - low[barkkk]) / range;
            sumpos += (close[barkkk] - low[barkkk]) * ratio * vol;
         }

         if(!(close[barkkk - 1] + sp * 0.2 < close[barkkk]))
         {
            if(high[barkkk] == ExtHighest[Count[kkk]]) ratio = 1;
            else ratio = (high[barkkk] - ExtLowest[Count[kkk]]) / range;
            sumneg += (high[barkkk] - close[barkkk]) * ratio * vol * -1;
         }

         sumhigh += range;
      }

      if(!sumhigh)
      {
         ExtPosBuffer[bar] = NULL;
         ExtNegBuffer[bar] = NULL;
      }
      else
      {
         ExtPosBuffer[bar] = sumpos / sumhigh * 100;
         ExtNegBuffer[bar] = sumneg / sumhigh * 100;
      }

      if(bar < rates_total - 1) Recount_ArrayZeroPos(Count, size);
   }

   for(bar = first2; bar < rates_total && !IsStopped(); bar++)
   {
      double sumPos = NULL;
      double sumNeg = NULL;
      double sum = NULL;
      for(int kkk = 0; kkk < int(InpAvgPeriod); kkk++) sum += ExtPosBuffer[bar - kkk] + ExtNegBuffer[bar - kkk];
      BSIBuffer[bar] = sum / InpAvgPeriod;
   }

   return(rates_total);
}
//+------------------------------------------------------------------+
ソースコードを詳しく解説
このコードは、MetaTrader 4 (MT4) プラットフォーム用のカスタムインジケータ「BSI (Bounce Strength Index)」を実装している。コードは、インジケータの設定、初期化、計算を行うための主要な部分で構成されている。以下に各セクションの詳細な説明を示す。
ヘッダー部分
//+------------------------------------------------------------------+
//|                                                          BSI.mq4 |
//|                                     Copyright 2024, FX-Bonus.net |
//|                                            https://fx-bonus.net/ |
//+------------------------------------------------------------------+
#property copyright "Copyright 2024, FX-Bonus.net"
#property link      "https://fx-bonus.net/"
#property version   "1.00"
#property strict
#property indicator_separate_window
#property indicator_buffers 3
#property indicator_plots   3
このセクションでは、インジケータの基本的な情報とプロパティが定義されている。
#property copyright、#property link、#property version:著作権、リンク、およびバージョン情報。#property strict:厳密な型チェックを有効する。#property indicator_separate_window:インジケータを別ウィンドウに表示する設定。#property indicator_buffers:インジケータが使用するバッファの数。#property indicator_plots:インジケータが描画するプロットの数。
インジケータのパラメータ設定
#property indicator_type1 DRAW_HISTOGRAM
#property indicator_color1 clrTeal
#property indicator_style1 STYLE_SOLID
#property indicator_width1 2
#property indicator_label1 "Floor Bounce Strength"

#property indicator_type2 DRAW_HISTOGRAM
#property indicator_color2 clrRed
#property indicator_style2 STYLE_SOLID
#property indicator_width2 2
#property indicator_label2 "Ceiling Bounce Strength"

#property indicator_type3 DRAW_LINE
#property indicator_color3 clrMagenta
#property indicator_style3 STYLE_SOLID
#property indicator_width3 2
#property indicator_label3 "Bounce Strength Index"

#property indicator_level1  10.0
#property indicator_level2  0.0
#property indicator_level3 -10.0
#property indicator_levelcolor clrBlue
#property indicator_levelstyle STYLE_DASHDOTDOT
この部分では、インジケータの描画スタイル、色、ラベル、およびレベルラインのプロパティが設定されている。
列挙型の宣言
enum Volume_Mode
{
   ENUM_WITHOUT_VOLUME = 1, // ボリュームを使用しない
   ENUM_VOLUME,             // ボリュームを使用する
   ENUM_TICKVOLUME          // ティックボリュームを使用する
};
ここでは、ボリュームの使用方法を指定するための列挙型 Volume_Mode が宣言されている。
インジケータの入力パラメータ
input uint InpRangePeriod = 20; // 範囲期間
input uint InpSlowing = 3;      // スローイング
input uint InpAvgPeriod = 3;    // 平均期間
input Volume_Mode InpUsingVolumeWeight = ENUM_TICKVOLUME; // ボリューム使用法
ユーザーが設定できるインジケータのパラメータが宣言されている。
グローバル変数の宣言
int Count[];
double ExtHighest[], ExtLowest[], ExtVolume[];
int min_rates_total, size, min_rates_1;
double ExtPosBuffer[], ExtNegBuffer[], BSIBuffer[];
インジケータの計算に使用されるグローバル変数が宣言されている。
配列の最新要素の位置を再計算
void Recount_ArrayZeroPos(int &CoArr[], int Size)
{
   int numb, Max1, Max2;
   static int count = 1;
   Max2 = Size;
   Max1 = Max2 - 1;
   count--;
   if(count < 0) count = Max1;
   for(int iii = 0; iii < Max2; iii++)
   {
      numb = iii + count;
      if(numb > Max1) numb -= Max2;
      CoArr[iii] = numb;
   }
}
この関数は、指定された配列の最新要素の位置を再計算する。
BSIインジケータの初期化関数
void OnInit()
{
   min_rates_total = int(InpRangePeriod + InpSlowing + InpAvgPeriod);
   size = int(MathMax(InpRangePeriod, InpSlowing));
   min_rates_1 = size;
   ArrayResize(Count, size);
   ArrayResize(ExtHighest, size);
   ArrayResize(ExtLowest, size);
   ArrayResize(ExtVolume, size);

   SetIndexBuffer(0, ExtPosBuffer, INDICATOR_DATA);
   PlotIndexSetInteger(0, PLOT_DRAW_BEGIN, min_rates_total);
   PlotIndexSetDouble(0, PLOT_EMPTY_VALUE, EMPTY_VALUE);

   SetIndexBuffer(1, ExtNegBuffer, INDICATOR_DATA);
   PlotIndexSetInteger(1, PLOT_DRAW_BEGIN, min_rates_total);
   PlotIndexSetDouble(1, PLOT_EMPTY_VALUE, EMPTY_VALUE);

   SetIndexBuffer(2, BSIBuffer, INDICATOR_DATA);
   PlotIndexSetInteger(2, PLOT_DRAW_BEGIN, min_rates_total);
   PlotIndexSetDouble(2, PLOT_EMPTY_VALUE, EMPTY_VALUE);

   string shortname;
   StringConcatenate(shortname, "BSI( ", InpRangePeriod, ", ", InpSlowing, ", ", InpAvgPeriod, ", ", EnumToString(InpUsingVolumeWeight), " )");
   IndicatorSetString(INDICATOR_SHORTNAME, shortname);
   IndicatorSetInteger(INDICATOR_DIGITS, 0);
}
この関数はインジケータの初期化を行う。各バッファのサイズを設定し、インジケータの表示名を設定する。
関数の宣言
int OnCalculate(
    const int rates_total,
    const int prev_calculated,
    const datetime &time[],
    const double &open[],
    const double &high[],
    const double &low[],
    const double &close[],
    const long &tick_volume[],
    const long &volume[],
    const int &spread[]
)
この関数は、MT4 プラットフォームによって呼び出され、インジケータの計算を行う。関数は以下の引数を受け取る:
rates_total: 利用可能なバーの総数。prev_calculated: 前回計算されたバーの数。time[]: 各バーの時間スタンプ。open[],high[],low[],close[]: 各バーの価格データ。tick_volume[],volume[]: 各バーのティックボリュームおよびボリュームデータ。spread[]: 各バーのスプレッドデータ。
初期化部分
if(rates_total < min_rates_total) return(0);

int first1, first2, bar;

if(prev_calculated > rates_total || prev_calculated <= 0)
{
    first1 = min_rates_1;
    first2 = min_rates_total;
    ArrayInitialize(Count, NULL);
    ArrayInitialize(ExtHighest, NULL);
    ArrayInitialize(ExtLowest, NULL);
    ArrayInitialize(ExtVolume, NULL);
}
else
{
    first1 = prev_calculated - 1;
    first2 = first1;
}
rates_total < min_rates_totalのチェックで、必要なバー数が揃っているか確認します。揃っていなければ関数は0を返して終了する。prev_calculatedを確認し、初回計算または再計算が必要かどうかを判断する。- 配列
Count,ExtHighest,ExtLowest,ExtVolumeを初期化する。
各バーに対する計算
for(bar = first1; bar < rates_total && !IsStopped(); bar++)
{
    double dmin = 1000000.0;
    double dmax = -1000000.0;
    double volmax = NULL;

    for(int kkk = 0; kkk < int(InpRangePeriod); kkk++)
    {
        dmin = MathMin(dmin, low[bar - kkk]);
        dmax = MathMax(dmax, high[bar - kkk]);
    }
    ExtLowest[Count[0]] = dmin;
    ExtHighest[Count[0]] = dmax;

    switch(InpUsingVolumeWeight)
    {
        case ENUM_WITHOUT_VOLUME:
            ExtVolume[Count[0]] = 1.0;
            break;
        case ENUM_VOLUME:
            for(int kkk = 0; kkk < int(InpRangePeriod); kkk++) volmax = MathMax(volmax, volume[bar - kkk]);
            ExtVolume[Count[0]] = volmax;
            break;
        case ENUM_TICKVOLUME:
            for(int kkk = 0; kkk < int(InpRangePeriod); kkk++) volmax = MathMax(volmax, tick_volume[bar - kkk]);
            ExtVolume[Count[0]] = volmax;
            break;
    }

    double sumpos = NULL;
    double sumneg = NULL;
    double sumhigh = NULL;
    for(int kkk = 0; kkk < int(InpSlowing); kkk++)
    {
        int barkkk = bar - kkk;
        double vol = 1.0;
        switch(InpUsingVolumeWeight)
        {
            case ENUM_WITHOUT_VOLUME:
                break;
            case ENUM_VOLUME:
                if(ExtVolume[Count[kkk]]) vol = volume[barkkk] / ExtVolume[Count[kkk]];
                break;
            case ENUM_TICKVOLUME:
                if(ExtVolume[Count[kkk]]) vol = tick_volume[barkkk] / ExtVolume[Count[kkk]];
                break;
        }

        double ratio = 0;
        double range = ExtHighest[Count[kkk]] - ExtLowest[Count[kkk]];
        range = MathMax(range, _Point);
        double sp = (high[barkkk] - low[barkkk]);

        if(!(close[barkkk - 1] - sp * 0.2 > close[barkkk]))
        {
            if(low[barkkk] == ExtLowest[Count[kkk]]) ratio = 1;
            else ratio = (ExtHighest[Count[kkk]] - low[barkkk]) / range;
            sumpos += (close[barkkk] - low[barkkk]) * ratio * vol;
        }

        if(!(close[barkkk - 1] + sp * 0.2 < close[barkkk]))
        {
            if(high[barkkk] == ExtHighest[Count[kkk]]) ratio = 1;
            else ratio = (high[barkkk] - ExtLowest[Count[kkk]]) / range;
            sumneg += (high[barkkk] - close[barkkk]) * ratio * vol * -1;
        }

        sumhigh += range;
    }

    if(!sumhigh)
    {
        ExtPosBuffer[bar] = NULL;
        ExtNegBuffer[bar] = NULL;
    }
    else
    {
        ExtPosBuffer[bar] = sumpos / sumhigh * 100;
        ExtNegBuffer[bar] = sumneg / sumhigh * 100;
    }

    if(bar < rates_total - 1) Recount_ArrayZeroPos(Count, size);
}
first1からrates_totalまでの各バーに対して計算を行う。- 各バーについて、
dminとdmaxを計算して、期間中の最低値と最高値を求める。 InpUsingVolumeWeightの設定に基づいて、ExtVolumeを設定する。- スローイング期間 (
InpSlowing) にわたって、ポジティブおよびネガティブの強度 (sumposとsumneg) を計算する。- ポジティブ強度は、現在の終値と最低値の差を基に計算。
- ネガティブ強度は、最高値と現在の終値の差を基に計算。
- 計算されたポジティブおよびネガティブの強度を、それぞれのバッファ (
ExtPosBuffer,ExtNegBuffer) に格納する。 - 必要に応じて、
Count配列のゼロ位置を再計算する。
BSI (Bounce Strength Index) の計算
for(bar = first2; bar < rates_total && !IsStopped(); bar++)
{
    double sumPos = NULL;
    double sumNeg = NULL;
    double sum = NULL;
    for(int kkk = 0; kkk < int(InpAvgPeriod); kkk++) sum += ExtPosBuffer[bar - kkk] + ExtNegBuffer[bar - kkk];
    BSIBuffer[bar] = sum / InpAvgPeriod;
}

return(rates_total);
first2からrates_totalまでの各バーに対して、BSI の計算を行う。sumPosとsumNegを平均期間 (InpAvgPeriod) にわたって合計し、BSI を計算する。- 計算された BSI を
BSIBufferに格納する。 - 最後に、計算が完了したバーの総数 (
rates_total) を返す。
まとめ
BSI (Bounce Strength Index) インジケーターのソースコードは、MetaTrader 4 (MT4) プラットフォーム用のカスタムインジケーターを作成するためのものだ。主な機能は価格データとボリュームデータを用いて市場のバウンス強度を計算し、視覚的に表示することである。
- インジケーターの設定: ヒストグラムとラインの描画設定、色、スタイル、幅を指定。
- 列挙型と入力パラメータの定義: ボリュームの使用方法や期間を設定。
- 配列とバッファの初期化: 計算に必要な配列とバッファを準備。
- BSI計算関数 (
OnCalculate): 各バーに対して最高値・最低値を計算し、ポジティブ・ネガティブ強度を求め、BSIを算出。
このインジケーターは、トレーダーに価格の反転ポイントの強度を示し、取引の意思決定をサポートする。


